Esports Charts introduces Media Value metric, now accessible to all
Esports Charts, a leading esports viewership analytics platform, has launched a new Media Value metric, now available for free across thousands of tournament pages on its website. For the first time, the esports industry has open access to a metric that shows the sponsorship potential of tournaments.
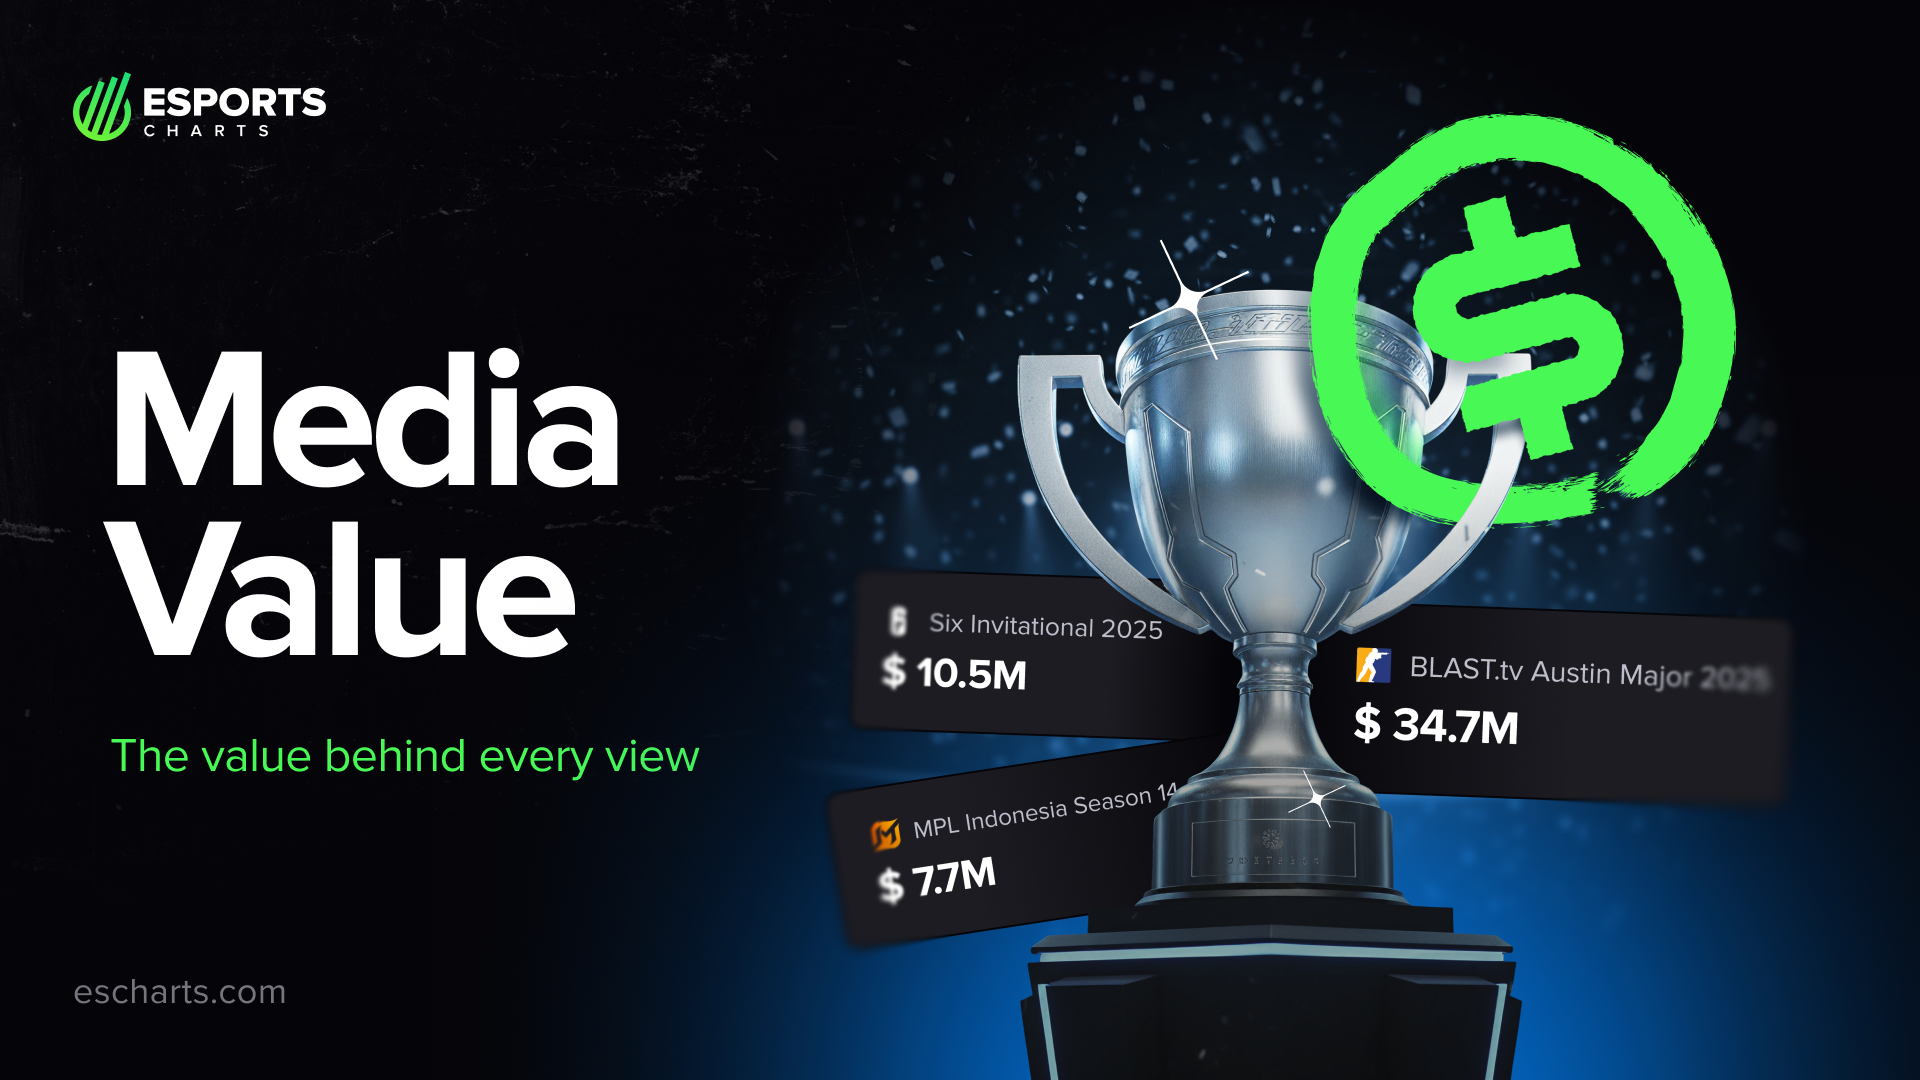
Media Value estimates the sponsorship potential of esports tournaments by calculating the market cost of a standardized 1% on-screen banner shown throughout the entire broadcast. This provides an at-a-glance understanding of how valuable a tournament could be for sponsorship decisions across regions and audiences.
“Making Media Value publicly accessible is a big step for esports transparency. For the first time, anyone can quickly see a clear, comparable benchmark for tournament sponsorship potential across regions. Our goal is to help the industry understand market dynamics more easily and make smarter commercial decisions, while still offering deeper, tailored insights for clients who need them.”
Viktor Proniakin, Product Manager at Esports Charts.
What Media Value Offers
- Standardized Metric: Media Value estimates the market cost of reserving a 1% on-screen banner for the full duration of a tournament.
- Calculated Across Regions: The metric adjusts for language- and region-specific CPMs, providing a comparable estimate of sponsorship potential across different markets.
- Practical Benchmark: Media Value is designed as a baseline for broadcast inventory only. It does not replace full sponsorship valuations, which may include VOD, on-site activations, product placements, or influencer integrations.
For those who’d like a straightforward breakdown of Media Value, check out our explainer: “How we calculate Media Value (and what it actually means)”.

Illustrative Example
Media Value highlights how language and regional audience composition impact the commercial value of broadcasts. For example, The International 2024 had a total Media Value of $23,104,343 across all 23 broadcast languages. Within this,
- the Indonesian-language streams accounted for $40,352,
- while the Spanish-language streams reached $183,468.

This demonstrates how the same tournament can have drastically different sponsorship potential depending on the language and region of its audience.
Explore Media Value now
You can check out any tournament's Media Value by just searching for it on our website. You can find the Media Value at the very top of the page. Don't know where to start? Here are some options:
2024 League of Legends World Championship — Highest Media Value of any esports tournament
MPL Indonesia Season 14 — Highest Media Value of any mobile esports tournament
2022 League of Legends World Championship — Highest Media Value of any North American esports tournament
FAQs
Q: Does Media Value equal what the organizer earned?
A: No. It’s an estimated market cost for the 1% banner; actual revenue depends on the organizer’s commercial package.
Q: Does every viewer count the same?
A: No. CPMs differ by region/language; for example, a European-language viewer generally carries a higher CPM than an Asian-language viewer.
Q: Are in-game spectator streams included?
A: Not in this release. Streams without visible sponsor placements (e.g., in-client views like DotaTV) are excluded.
About Esports Charts
Esports Charts is an analytical service that timely aggregates viewership insights about esports, sports, and entertainment events. Since 2016, we have been focused on making esports data more accessible and transparent for businesses and the broader community of esports enthusiasts. Our ability to analyze tournament information from streaming platforms, offering comprehensive viewership statistics as well as detailed analytics on players, organizations, and games—all in one centralized place, sets Esports Charts apart in the market.

Detailed Esports data at your fingertips.
Subscribe to & start exploring!


