
Turn Your Audience Into
Sponsorship Revenue

One esports team analytics dashboard for every game, roster and platform. Benchmark against rivals and send sponsors numbers they can check — not estimates.

Plans from $300/month · No setup fee

Renewing our partnership with Esports Charts is strategic for FURIA. Having access to reliable, real-time data allows us to make quick, assertive decisions, better understand our audience's behavior and deliver more value to our athletes, fans and partners.

FURIA Milton Stiilpen JuniorCTO at FURIA Esports

The problem

Sponsors Want Numbers. You're Sending Screenshots.

You compete in CS2, Valorant and mobile titles, streamed on Twitch, YouTube, Kick, SOOP, CHZZK and 9 more platforms. One total for your organization takes hours you don't have.

Peak viewers, hours watched, platform split, audience reach — all pulled manually. By the time the deck is ready, the numbers are stale.

Without benchmarks or historical trends, growth is a feeling. Sponsors, investors, and tournament organizers want numbers — not narratives.

Features

Esports Team Analytics for Every Sponsor Question

Esports Charts Teams Dashboard is an esports team analytics tool that combines Hours Watched, Peak Viewers, Average Viewers and Airtime for every game, roster and platform your organization plays on — with competitor benchmarks, monthly achievements and one-click exports for sponsor reports.

Performance

Your Whole Organization in One Number

Hours Watched, Peak Viewers, Average Viewers, Airtime and Matches for the entire organization — every game and roster, in one place — the number sponsors ask for first.

Filter by game or roster, pick the period, compare month over month or all time, and export to CSV or PowerPoint in one click.

Audience

Know Your Audience Before Your Sponsors Ask

See how your audience splits by language and platform, and how that mix shifts month to month — the markets you can sell to sponsors.

RRQ case study: discovered 71% of their viewership came from mobile-game audiences on YouTube and TikTok — a finding that directly reshaped their sponsorship pitch.

Match detail

Show Sponsors Your Share of Every Tournament

Open any match your organization played: Hours Watched, Peak Viewers, Average Viewers, Airtime, platform and language split — in one table. Switch to All-Time to see your best matches ever.

Then see your share of the tournament: what part of the event's total Hours Watched your team drew. Even without a trophy, that number belongs in every sponsor deck.

New

See Exactly How You Stack Up Against Rivals

Teams used to track rivals by hand, pulling numbers from several sources. The Competitors tab does it for you.

Add any organization, pick a time range and compare Hours Watched, Peak Viewers, Average Viewers and Airtime side by side. See when rivals peaked, in which match and game — and know where you stand before your next negotiation.

Reporting

Monthly Wins, Ready to Share With Sponsors

Every month, Esports Charts highlights your own achievements month-over-month and provides audience highlights from events you played. This can include achievements like #1 team by Hours Watched, #1 by Average Viewers, top match, viewership records.

Paste them into partner reports, stakeholder updates or social posts without pulling a single number by hand.

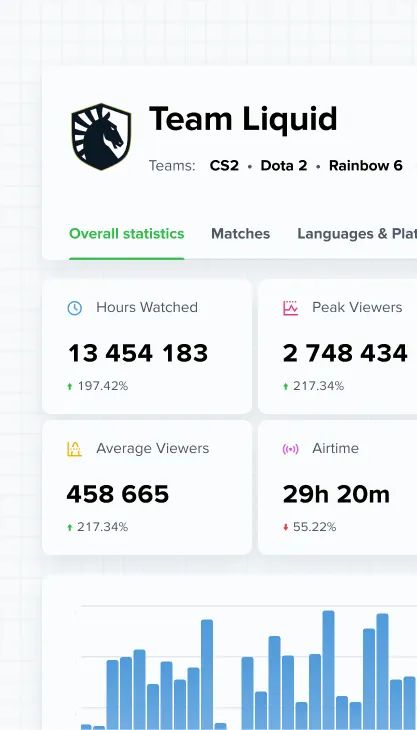
The team page for Team Liquid, with teams in CS2, Dota 2 and Rainbow 6, on its Overall statistics tab: Hours Watched 13,454,183 up 197.42%, Peak Viewers 2,748,434 up 217.34%, Average Viewers 458,665 up 217.34% and Airtime 29h 20m down 55.22%, above a month-by-month column chart.
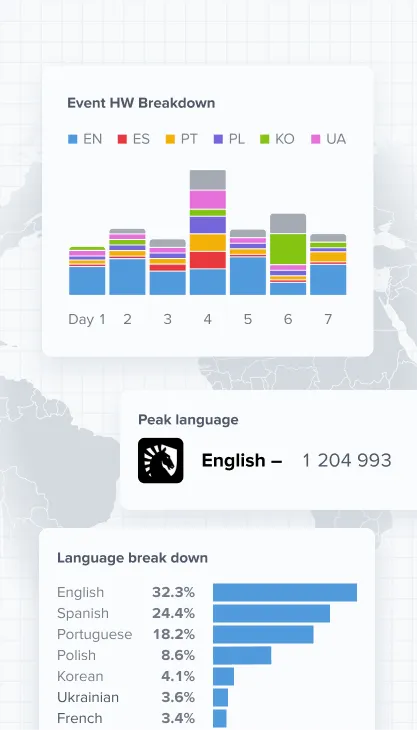
Language and audience: hours watched stacked by language over seven days of an event; peak language English with 1,204,993; and a full breakdown — English 32.3%, Spanish 24.4%, Portuguese 18.2%, Polish 8.6%, Korean 4.1%, Ukrainian 3.6%, French 3.4%.
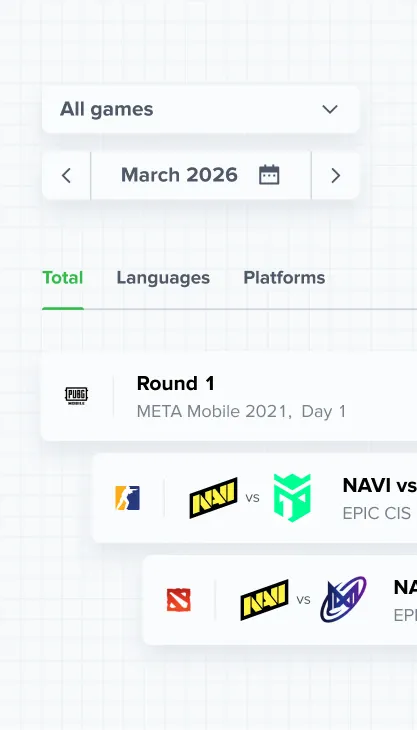
The match list under an all-games filter and a month picker, with Total, Languages and Platforms views: Round 1 of a PUBG Mobile event, then two matches shown with both clubs' crests — NAVI against another org in EPIC CIS, and a Dota 2 tie.
Competitors Last 12 months New Organization Hours watched You vs. Your team Peak 1.2M 42.3M — Rival A Peak 980K 38.1M +11% Rival B Peak 1.5M 51.4M −18% Rival C Peak 740K 29.7M +42% Add any organization to the comparison
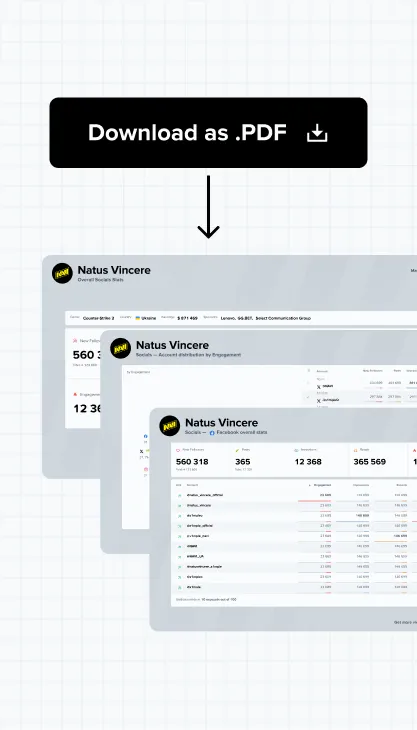
A report export: a Download as .PDF button above three stacked report pages for Natus Vincere — overall socials stats, account distribution by engagement, and per-account Facebook stats.

What teams say

Why Organizations Spend 5+ Years with Esports Charts

Add-on

Add Social Media — See Your Team's Full Footprint

Streaming is only part of the story. Pair your Teams Dashboard with Esports Charts Social Analytics to track follower growth, engagement rate, and reach across all major platforms.

Cross-reference streaming viewership spikes with social momentum. Show sponsors not just who watches — but who follows, shares, and engages.

  • Instagram
  • X
  • Facebook
  • TikTok
  • YouTube VOD
  • Twitch
The Social Analytics add-on: six metric tiles — New Followers 560,318, Posts 365, Impressions 12,368, Reach 365,569, Engagement 12,368 and Media Value $121,368, each with its change on the period — beside Facebook, Instagram, YouTube and Twitch marks and a pie chart splitting media value across the organization's accounts.

More tools for your organization

More Ways to Grow Sponsorship Revenue

Teams Dashboard is the core. These tools help you find opportunities, benchmark and build the sponsor deck.

Dashboard

Rival & Market Benchmarking

Compare any set of organizations side by side — Hours Watched, Peak Viewers, Average Viewers, Airtime — across games and regions. Useful for opportunity identification, market analysis and investor updates.

See plans

Custom report

Consulting & Custom Reports

Need a one-off deep dive, a sponsor deck built on your data, or analysis beyond the dashboard? Our analysts build custom reports in your format, with the metrics your partners care about.

Request a report

Get started

Start Sending Sponsors Numbers They Trust

Stop rebuilding reports from scratch. Start your next renewal with data.

Teams Dashboard

From $300/ month

Billed monthly · Cancel anytime

Add-ons: Rival & Market Benchmarking · Logo Recognition (custom pricing) · Social Performance · Consulting & Custom Reports

What’s included

  • Overall statistics (HW, PV, AV, Airtime, Matches)
  • Match-level analytics with language & platform breakdown
  • Monthly, quarterly & annual breakdowns
  • Event performance with tournament share %
  • CSV export — any view, one click
  • Games breakdown across all titles
  • Roster comparison
  • Competitors tab
  • Monthly achievements
  • All-time records view

Book a Demo

Respond in 24h

or

Want to talk today?

Pick a 30-minute slot and get a live walkthrough on your schedule.

Book a call

No account needed · 30 min · Free

To use this feature, please sign in

Sign in

Sign In to use this feature

Sign in