
Show Sponsors the Full Audience
of Every Esports Tournament
Official channels, co-streams and every major platform in one total — live during the broadcast and as a sponsor-ready report after it. No more stitching numbers by hand.
Trusted by leading tournament organizers worldwide


Cross-platform totals · Per-minute live data · Data since 2016
The problem
Running events is hard enough. Your analytics shouldn't make it harder.
Most tournament organizers are juggling spreadsheets, manual pulls, and on-platform metrics that change without notice. Here's what that costs you.
Twitch, YouTube, Kick, SOOP, CHZZK — each with its own dashboard, its own export format, and its own definition. Consolidating it after every event burns analyst hours you can't spare.
Your sponsors expect proof-of-value within 48 hours. Instead, your team spends 3 days compiling numbers, taking screenshots, and formatting slides — for every single event on your calendar.
Schedule a match at 14:00 or 16:00? Which region is peaking right now? When your production team needs answers, they're looking at yesterday's numbers — or nothing at all.
What you get
Esports Tournament Analytics, From First Match to Sponsor Report
Esports Charts is a tournament analytics platform that combines official broadcasts, co-streams and 13 streaming platforms into one audience picture — Chinese platforms reported separately — with per-minute live data during the event and sponsor reporting on logos and on-air mentions after it.
Report Complete Numbers for Every Stage
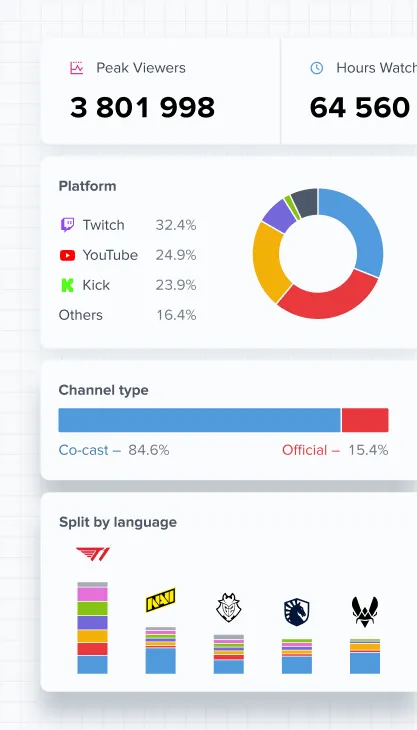
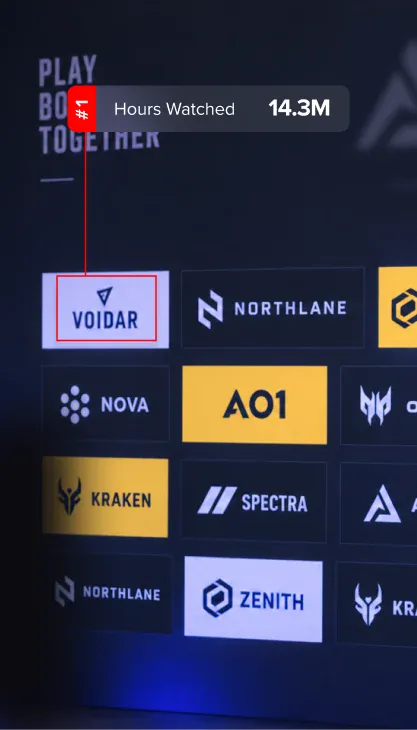
Full viewership for your tournament, from group stage to Grand Final: Hours Watched, Peak Viewers, Average Viewers and Airtime across every region, language and co-stream. Benchmark against past editions and competing events in seconds.
- Hours Watched
- Peak Viewers
- Average Viewers
- Platform Breakdown
- Language Split
- Stage Comparison
Give Your Broadcast Team Live Numbers
Live Data Access streams per-minute viewer counts from every platform to your production team during the broadcast. Works with OBS, XSplit and custom dashboards via API — see the minute viewership spikes and which match drives it.
- Per-Minute Granularity
- OBS / XSplit Integration
- API Access
- Multi-Platform Live API
Sell Season Deals on Season Data
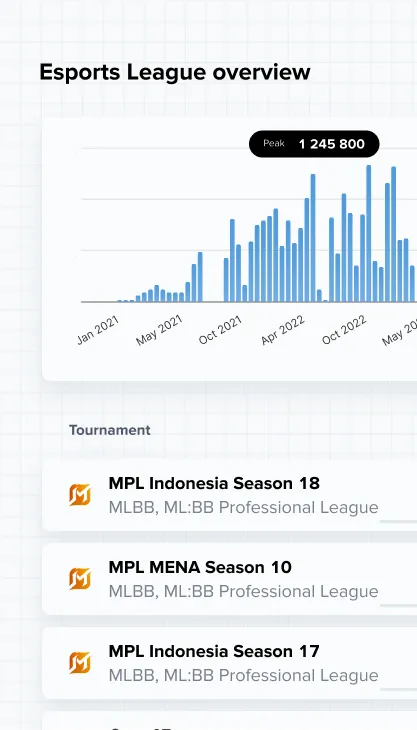
The Series Dashboard tracks viewership across a whole season or league. Compare stages, find the formats and matchups that draw the biggest audiences, and pitch sponsors multi-event deals with history behind them.
- Matchup Performance
- Stage vs. Stage
- Season-Long Trends
- Historical Benchmarks
Know Which Markets Carried Your Event
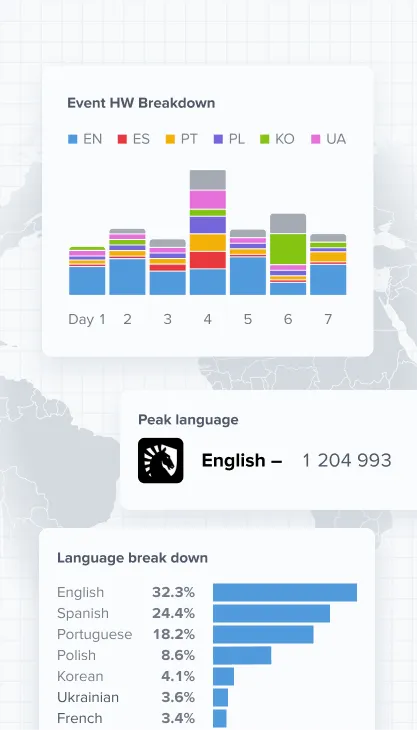
The language and platform breakdown shows which communities and platforms carried your event, day by day. Find languages worth an official co-stream, check whether a platform deal delivered, and show sponsors the audience they reached.
- Language Split
- Peak Language
- Platform Split
- Day-by-Day View
Turn Co-streamers Into Official Partners
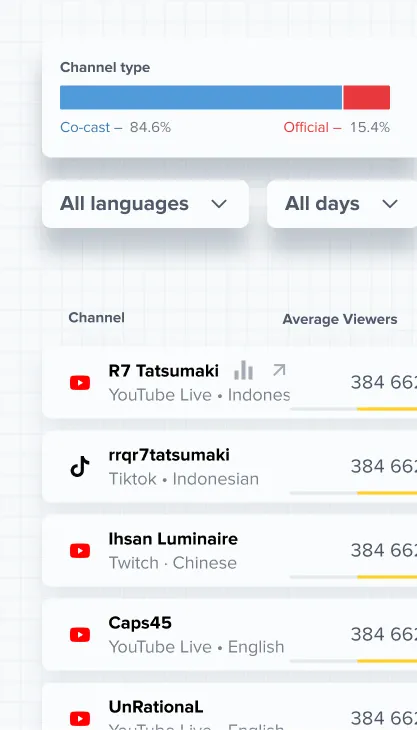
The Co-streaming Leaderboard shows which streamers co-streamed your event and how much audience each one added. Rank by peak viewers, hours watched or language, and pick talent for official partnerships before your next event.
- Co-stream Viewership
- Streamer Rankings
- Language Breakdown
- Partnership Insights
Hand Sponsors a Report that Sells Itself
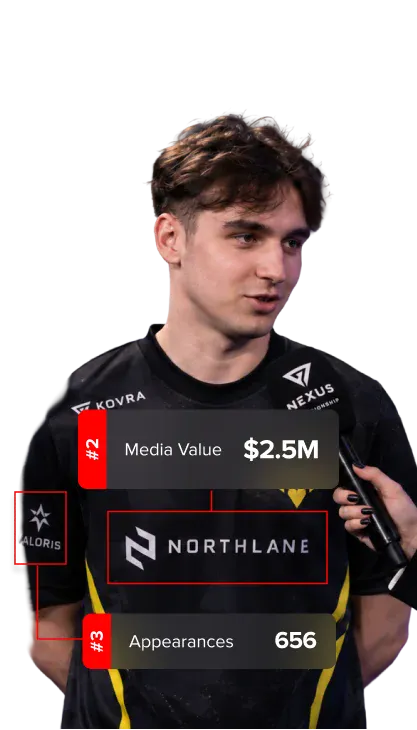
Logo & Audio Recognition detects sponsor logos and spoken mentions across your broadcasts and calculates media value per placement from viewership, screen time and visibility — the core of your post-event sponsor report.
- Logo Detection
- Audio Mentions
- Media Value Score
- Sponsor ROI Report
Coverage
Every platform your audience watches on
Stop choosing which platforms to track. Esports Charts brings 13 streaming platforms into one consistent data model, with Chinese platforms reported separately — so you always know what your total includes.
 Twitch
  YouTube Gaming
  Kick
Kick  SOOP Korea
  CHZZK
CHZZK  Rumble
  NimoTV
  Bigo LIVE
  SteamTV
  Douyu
Douyu  Huya
Huya  Bilibili
  CC163
CC163
Included in your plan
- Events Dashboard
- Live Data Access
- Series Dashboard
- Language & Platforms
- Co-streaming Leaderboard
- Logo & Audio Recognition
- 13-Platform Coverage
Get started
Ready to run your next event with complete data?
Tell us about your tournament calendar, reporting needs and business goals. We'll put together the right mix of dashboards, live data, audience analytics and custom reports.
Skip the queue — pick a 30-min slot and get a live walkthrough on your schedule.
Book a Demo
Respond in 24hRun your next event with complete data