56K+
Teams & Organizations
Every organization with sponsorship inventory. Filter by game, region, tier and audience size.

Pick the tournaments and teams that reach your audience, then measure what every placement earned — in reach, airtime and USD media value. Independent data, not numbers from the teams you pay.
Trusted by leading brands in esports



Independent measurement · 13 streaming platforms · Data since 2016
Esports by the numbers
Esports Charts is an independent esports sponsorship measurement platform. It tracks 91K+ tournaments and 56K+ teams across 13 streaming platforms, so brands can compare audiences before signing and measure airtime, reach and USD media value after every event.
56K+
Every organization with sponsorship inventory. Filter by game, region, tier and audience size.
91K+
From regional qualifiers to world championships with 1M+ peak viewers. Compare audiences before you commit.
13
Twitch, YouTube, Kick and regional platforms — the total audience, not one channel.
161
See which titles your target audience actually watches, by market and language.
Why brands struggle in esports
Most brands don't fail in esports because of bad instincts. They fail because they skip the fundamentals before committing.
Big viewer numbers don't tell you whether an event, team or game reaches the people you sell to. Check markets, languages, platforms and viewing patterns before budget moves.
Your logo was on jerseys, stage banners and broadcast graphics. Exposure isn't a result until it's measured: how long it was on screen, how many people saw it, and what that airtime is worth next to your other media.
Esports should compete for budget on the same terms as any other channel. Independent audience data and USD media value give finance a business case it can check — and your team a clear call to renew, expand, renegotiate or walk away.
The sponsorship cycle
Research partners before the deal, measure delivery during the season and bring proof to the renewal — without switching tools.
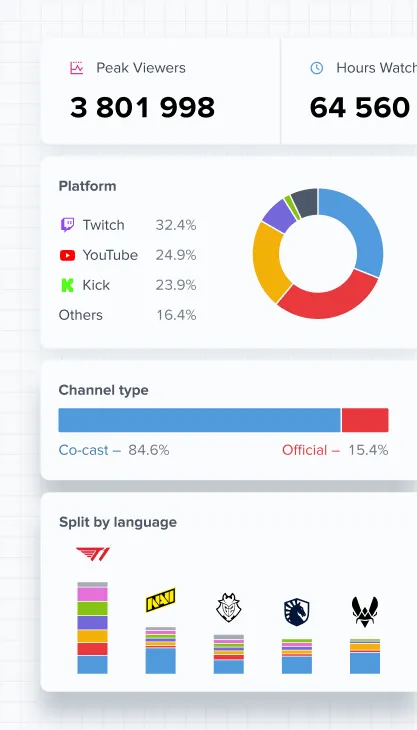
Research any tournament before you sign: historical viewership, peak and average viewers, platform and language split, year-over-year growth. Once the deal is live, follow the event in real time and get a post-event performance summary.
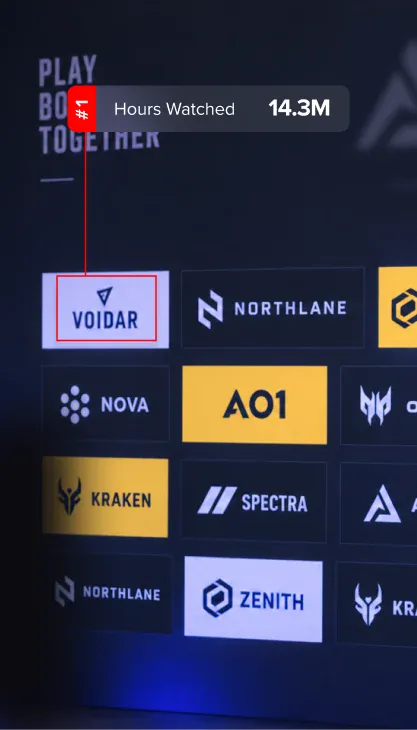
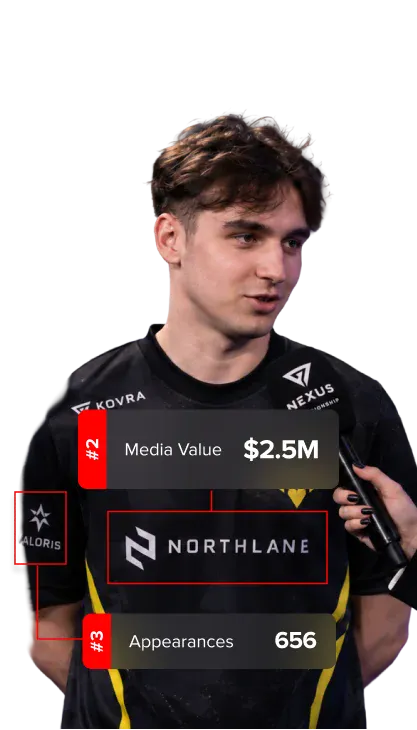
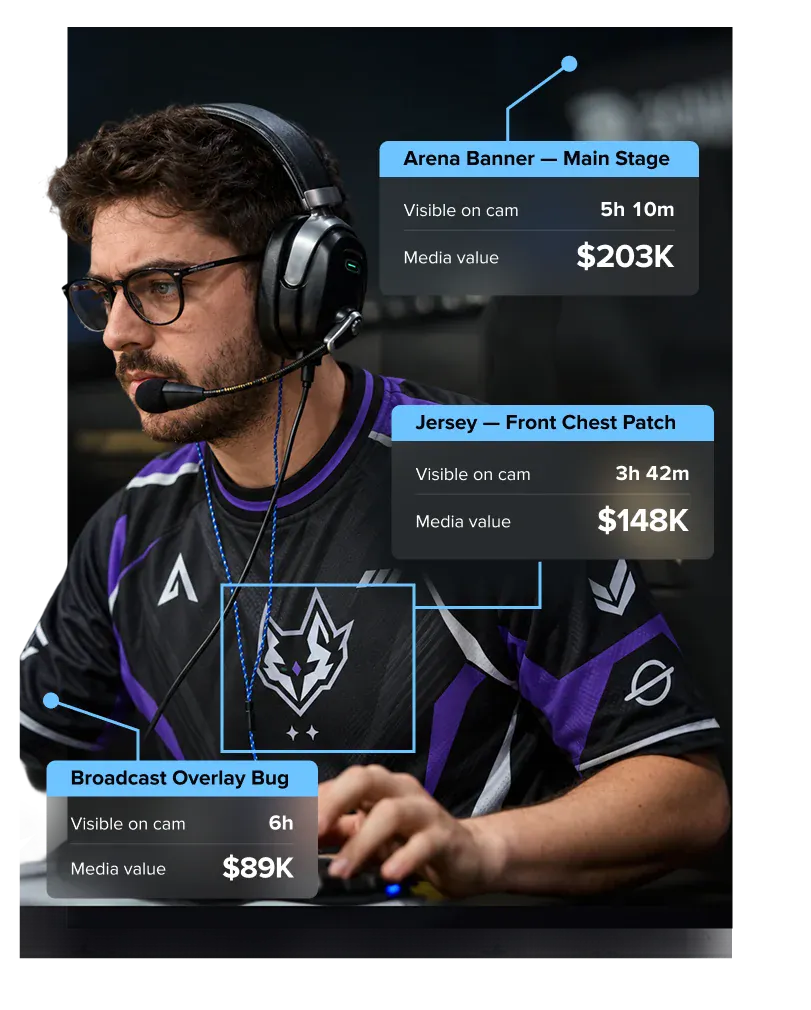
Every second your logo is on stream is detected and logged — jerseys, arena banners, broadcast overlays, camera-facing backdrops. Each placement gets airtime, impressions and a USD media value benchmarked against the CPM of an equivalent ad buy.
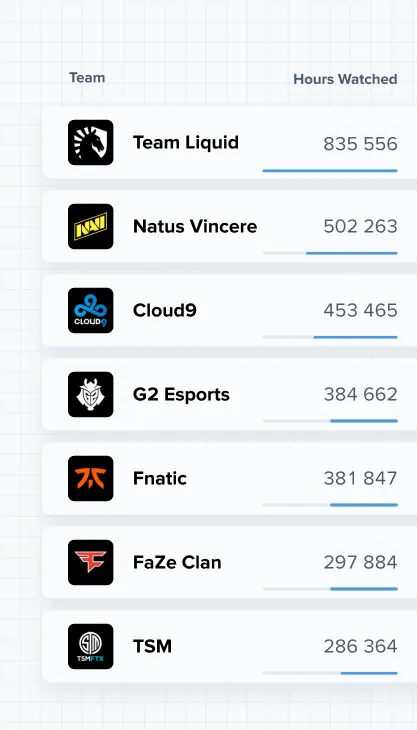
Compare 56K+ teams by average viewers, peak events, platform mix, audience languages and growth. Know which organization fits your brand before the first call.
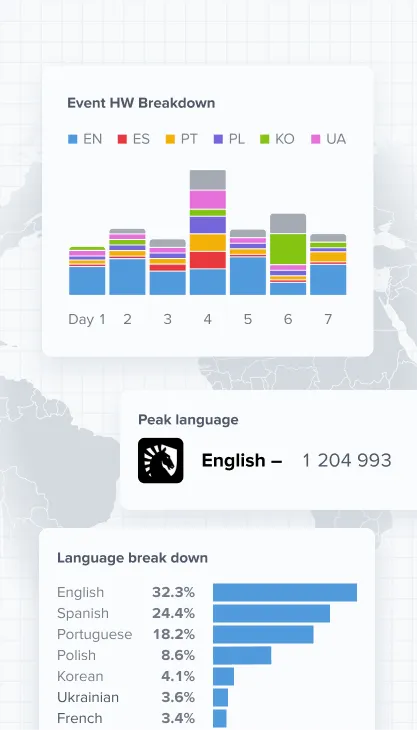
See which languages carry the audience of any event or team, and on which platforms. Know whether your buyers watch in English, Spanish, Portuguese or Korean — on Twitch, YouTube or regional platforms.
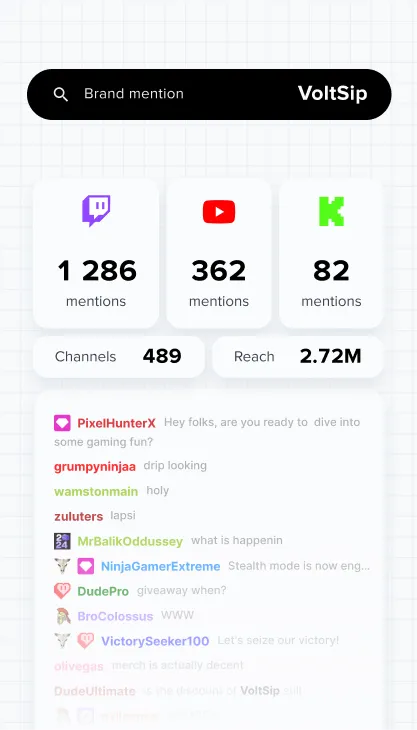
Count mentions of your brand, campaign hashtag or product in Twitch, YouTube and Kick chats, across official broadcasts and co-streams. Search every channel at once or one broadcast at a time — and show active engagement, not just passive viewing.
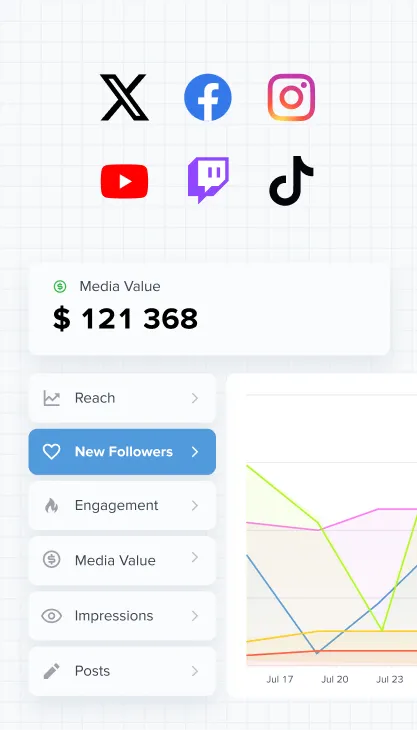
Your partnership keeps working after the broadcast ends. Follow the social channels of the teams you sponsor — follower growth, post engagement and reach — alongside their stream audience, in the same account.
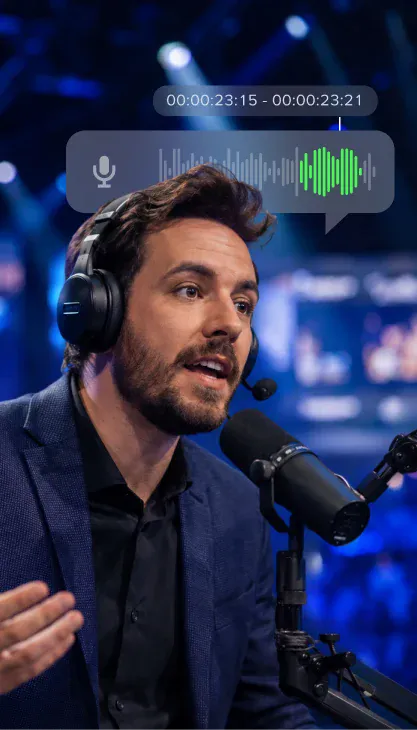
A caster naming your brand in a major broadcast is earned media. Audio Recognition finds brand mentions in live broadcasts and VODs, so the on-air coverage in your package gets a number too.
Logo Recognition — deep dive
Logo Recognition gives you the exact numbers — minutes of airtime, impressions per placement and the USD media value of every second your brand was on screen.
That gives your team a defensible basis to evaluate, renew or renegotiate the sponsorship.
Ready to measure your esports investment?
A demo isn't a sales pitch. In 30 minutes we show your target events, the real audience of your potential partners, and a Logo Recognition report for a brand like yours.
Sponsorship decisions take time — most of our brand clients evaluate for 3–12 months before signing. Start with the data, not the pitch deck.
Skip the queue — pick a 30-min slot and get a live walkthrough on your schedule.
Let's Walk Through the Data Together